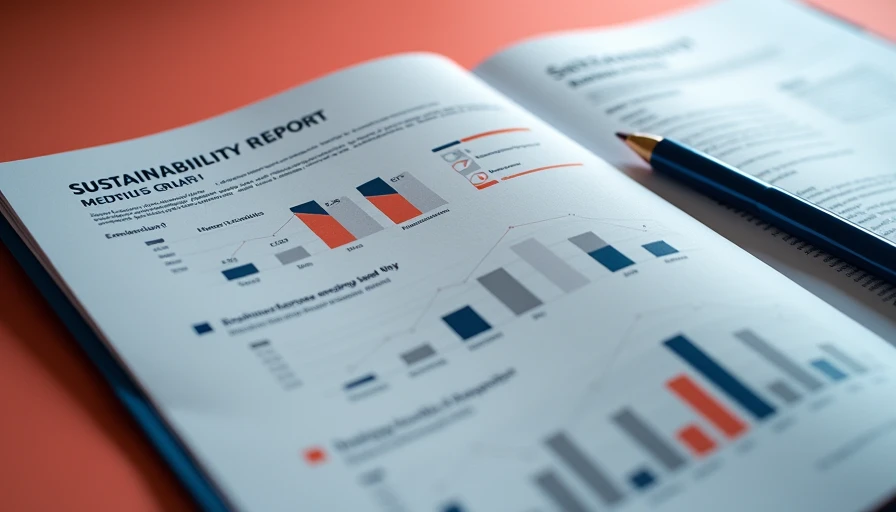
In a fleet operation, ESG reporting is not a glossy sustainability exercise. It is a disciplined way to show what fuel, maintenance, safety, labor, and compliance decisions do to cost per mile and uptime. If your company runs 20 trucks or 5,000 vehicles, the CFO, customers, lenders, and procurement teams increasingly want evidence behind environmental and social claims. The good news is that most of the useful data already sits in your fuel cards, maintenance system, telematics platform, payroll files, and accident records.
The practical question is simple: what does it cost, what does it pay back, and what does it trigger with DOT? Done correctly, ESG reporting helps a fleet identify avoidable fuel burn, reduce roadside failures, document driver-safety controls, and compete for contracts that include emissions or supplier-score requirements.
Start with the fleet numbers that matter
A strong report begins with a narrow operating boundary. Decide whether you are measuring company-owned trucks, leased assets, employee vehicles used for business, warehouses, charging equipment, or all of them. Write that boundary down before anyone pulls data. Otherwise, one department reports gallons purchased while another reports gallons consumed, and the year-over-year comparison becomes useless.
For most fleets, the first environmental measures are fuel gallons, miles traveled, fuel economy, idle hours, electricity used for charging, and estimated greenhouse-gas emissions. Track these by vehicle class and route type. A regional straight truck running urban deliveries should not be compared directly with an over-the-road tractor. The comparison needs context, or management will chase a bad target.
The social side is just as operational. Record preventable crashes, injuries, driver turnover, training completion, hours-of-service violations, and inspection results. These figures connect directly to insurance expense, recruiting costs, lost loads, and out-of-service time. Governance covers who owns the data, who approves fleet policies, and how exceptions are documented.
Fleet Impact: A 2% improvement in fuel economy on a 400-vehicle fleet can be material even before incentives or customer benefits enter the calculation. Multiply annual gallons by the average fuel price, then compare that value with the cost of coaching, idle controls, or equipment changes.
Build ESG reporting from existing systems
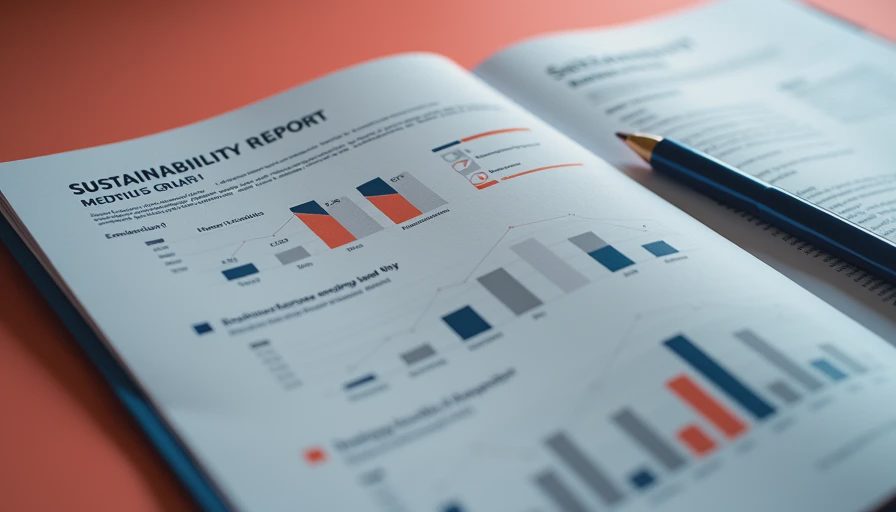
Do not begin by buying a specialized platform. Begin with a data map. List every source, its owner, update frequency, unit of measure, and likely error. Fuel-card records may contain gallons and dollars but not reliable mileage. Telematics may provide engine hours, odometer readings, harsh events, and idle time, but devices can go offline. Maintenance software may show repair orders without separating warranty work from preventable damage.
Create one monthly control sheet with vehicle identification numbers, asset class, miles, gallons, idle hours, maintenance spend, downtime hours, incidents, and driver headcount. Reconcile totals against accounting and fuel invoices. If the fleet logged 4.2 million miles but fuel records support only 3.8 million, stop and investigate. A polished dashboard built on mismatched inputs is worse than a plain spreadsheet with an honest exception note.
For emissions, use a consistent calculation method and document the fuel factors used. Diesel, gasoline, renewable diesel, and electricity should not be mixed into one unexplained figure. Scope 1 generally covers direct emissions from fuel burned in company-controlled vehicles. Purchased electricity is commonly treated separately as Scope 2. Scope 3 can involve contracted transportation, purchased goods, or employee travel, but its boundary requires careful definition.
ESG reporting should also identify estimates. If charging meters are missing, state how electricity use was calculated. If a leased vehicle lacks complete mileage, label the gap rather than filling it with a convenient assumption. That transparency protects credibility when a customer, auditor, or lender asks how the number was produced.
Turn environmental data into a payback decision
Environmental goals only survive budget meetings when they are tied to operating results. Suppose a fleet is considering idle-reduction software, auxiliary power units, aerodynamic equipment, route changes, or electric replacement vehicles. Put each option into the same model: purchase price, installation, incentives, maintenance effect, fuel or electricity savings, expected annual miles, downtime risk, and useful life.
An electric van can lower energy and routine maintenance costs, but the analysis must include charger installation, demand charges, battery warranty terms, winter or summer range, and route dwell time. A diesel tractor with a lower sticker price may remain the better choice on a long-haul route with limited charging access. That is not an anti-electric conclusion; it is a route-level conclusion.
Use pilot groups rather than promises. Compare similar routes over at least several operating cycles, controlling for payload, weather, driver assignment, and traffic where possible. Report both total savings and savings per mile. A project that saves $18,000 annually but requires $90,000 upfront has a five-year simple payback before financing and support costs. Your CFO needs that answer immediately.
Fleet Impact: Pair every environmental metric with a cost metric. Gallons per mile belongs beside fuel cost per mile. Idle hours belong beside engine-hour maintenance and fuel spend. Charging energy belongs beside electricity cost and vehicle availability.

Connect safety and compliance to the report
Social performance is not a collection of soft statements. It is measurable control over the risks that put drivers, the public, and the company at risk. Track new-hire training, annual policy acknowledgments, coaching after telematics events, preventable collision rates, injury claims, and driver turnover. Separate leading indicators, such as completed coaching, from lagging indicators, such as crashes and workers compensation claims.
For regulated motor carriers, keep ESG reporting aligned with actual compliance records. Hours-of-service compliance, driver qualification files, vehicle inspection records, and maintenance documentation remain governed by applicable FMCSA and DOT requirements. A sustainability report does not replace those records, and a low emissions figure does not offset poor vehicle maintenance. If an inspector finds missing documentation, the operational and financial consequences are real regardless of how attractive the annual report looks.
Governance also means assigning accountability. Name the fleet operations owner, finance reviewer, safety reviewer, and executive approver. Establish a correction log for late fuel files, duplicate vehicles, unexplained mileage, and missing incident reports. Keep source documents for the reporting period so the team can reproduce the result months later.
Use the report in procurement and fleet planning
Customer requests are often where ESG reporting becomes commercially useful. A shipper may ask for emissions per shipment, alternative-fuel plans, safety performance, or supplier training controls. Do not answer with a generic pledge. Provide a defined boundary, reporting period, calculation method, baseline, and improvement plan. If a customer asks for carbon intensity, explain whether the denominator is mile, ton-mile, shipment, or revenue. Those are different measures.
The same information improves replacement planning. A vehicle with high fuel cost, repeated downtime, rising repair spend, and poor route fit deserves attention before a newer asset with strong uptime. Build a replacement score that combines lifecycle cost, emissions, safety technology, utilization, and expected resale value. This lets procurement defend specifications with operating evidence instead of preference.
When comparing vendors, ask how data is exported, whether raw records remain accessible, how missing data is flagged, and whether the platform supports mixed powertrains. A low monthly subscription is not a bargain if analysts spend two days each month cleaning files manually.
A practical 90-day implementation plan
During the first 30 days, define boundaries, assign owners, collect baseline fuel and mileage data, and document gaps. Do not set a reduction target until the baseline passes a basic reconciliation. During days 31 through 60, add maintenance spend, downtime, safety events, training, and driver-retention measures. Review the first dashboard with dispatch, maintenance, safety, finance, and executive leadership together.
During days 61 through 90, select one or two controlled projects. That could be idle reduction on a regional fleet, tire-pressure compliance, route consolidation, EV van deployment, or preventive-maintenance interval review. State the expected cost, payback period, operational risk, and measurement method before launch. At the end of the pilot, report the result honestly, including failed assumptions.
The best ESG reporting process is not the one with the most polished charts. It is the one that helps a fleet manager remove wasted fuel, prevent downtime, protect drivers, satisfy customer questions, and defend capital requests. Keep the data traceable, connect every target to a fleet outcome, and make the report useful enough that operations checks it before the next budget meeting.