
Fuel efficiency goes straight to the operating budget: at $4 per gallon, improving a truck from 6 to 6.5 miles per gallon cuts fuel cost from about 67 cents to 62 cents per mile. Over 100,000 miles, that is roughly $5,100 per truck before implementation costs. Those are illustrative numbers, not a promised result. Start with your own gallons and miles, then target the routes and vehicles where a change can pay for itself without creating downtime or a safety problem.
Measure fuel efficiency in dollars, not just MPG
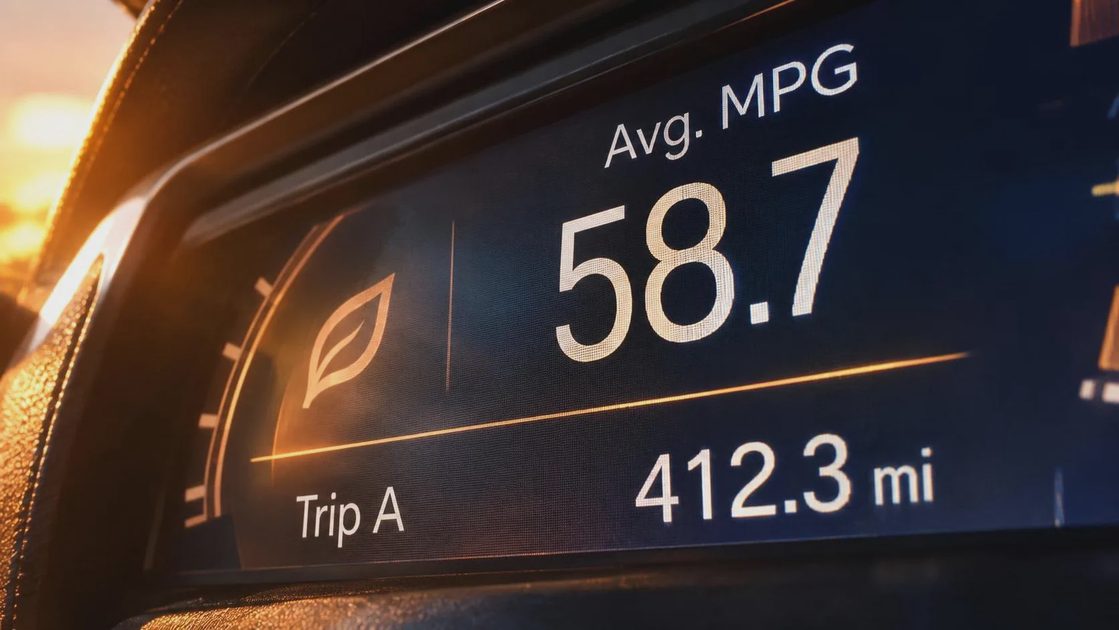
Three numbers your CFO will ask about are gallons consumed, miles traveled, and total fuel cost. Use them to calculate fleet MPG as total miles divided by total gallons. Calculate fuel cost per mile as total fuel spending divided by total miles. Do not average individual truck MPG figures without weighting them by miles or gallons; a lightly used truck should not carry the same weight as a high-mileage tractor.
Use a consistent period and reconcile fuel-card purchases with bulk-tank withdrawals. A tank that is fuller at the end of the month than at the beginning can distort a short-period calculation, as can fuel purchased outside the reporting window. Review missing odometer readings, duplicate transactions, and fuel assigned to the wrong vehicle before treating a dashboard as a management report.
Separate diesel, gasoline, and electric vehicles. For EVs, track energy cost per mile and electricity consumed, including charging losses where your meter captures them. MPG is not a useful common denominator for a mixed-powertrain budget. Compare total energy spending across the fleet, but keep the underlying measures separate.
Fuel efficiency comparisons also need context. A delivery van making frequent stops should not be ranked against a highway tractor. Group vehicles by duty cycle, payload, terrain, and season where practical. A route change or a heavier load can move the number even when driver behavior and maintenance stay the same.

Find the gallons you can actually eliminate
Idling is a sensible first audit because the engine is running while the odometer is not. Review idle hours by vehicle and reason, not just by driver. Waiting at a customer gate, powering equipment, cabin temperature, and mandated rest can all produce legitimate idle time. Work with dispatch and customers on recurring delays before issuing a blanket shutdown instruction.
For fuel efficiency projects involving idle reduction, calculate savings from measured fuel consumption where available. If you only have idle hours, use an engine-specific estimate and label it as an estimate. Then subtract the cost of alternatives such as auxiliary power, installation, maintenance, and any added energy use. Never ask a driver to shut down when doing so would compromise safety, required vehicle functions, or a safe rest environment.
Speed is another controllable cost, but a policy needs to fit the route and operating conditions. Compare similar trips and look for sustained high-speed operation rather than punishing a driver for a single reading. A lower governed speed can also change trip time and scheduling capacity, so include labor and service commitments in the business case. Drivers remain responsible for operating safely in the conditions they encounter.
Routing deserves the same discipline. Look for repeated empty miles, unnecessary out-of-route travel, and avoidable customer waits. A shorter route is not automatically cheaper if it adds congestion, tolls, or a delivery failure. Pilot dispatch changes on comparable runs and review on-time service alongside fuel cost per completed delivery.
Maintenance protects fuel efficiency and uptime
Start with tires. Check pressure when tires are cold and use the tire and vehicle manufacturers' load and inflation guidance, along with applicable fleet specifications. A pressure program is not just a fuel project: it also helps identify damage and recurring air loss before a roadside event. Do not trade away adequate load capacity for a lower rolling-resistance claim.
Dragging brakes, wheel-end problems, alignment issues, and engine fault codes can waste fuel or signal a larger repair. Investigate a sudden change in fuel consumption alongside inspection findings and fault reports rather than assuming the driver caused it. An unresolved defect can cost far more in downtime than the fuel it consumes.
Use the manufacturer-recommended oil specification and service intervals appropriate to the duty cycle. A lubricant change justified solely by a projected MPG gain needs a documented trial and the right engine approval. The same goes for aerodynamic add-ons: account for installation, repairs, route suitability, and whether the equipment interferes with vehicle operations.
Build a pilot finance can audit
Pick a manageable group of comparable vehicles and a similar comparison group. Record the baseline period, routes, loads, mileage, gallons, fuel price, and maintenance events. Run the pilot long enough to capture normal operating variation, then document any major changes in weather, customer mix, or dispatch patterns. A comparison group helps, but it does not automatically eliminate every difference.
Fleet Impact: Suppose 10 trucks each travel 100,000 miles annually. At 6 MPG, they consume about 166,667 gallons; at 6.5 MPG, about 153,846 gallons. The difference is approximately 12,821 gallons, worth about $51,282 at an assumed $4 per gallon. If a project costs $20,000 upfront and $5,000 annually to operate, illustrative first-year net savings are about $26,282. Simple payback is roughly 5.2 months, calculated using annual savings after operating costs. Actual results depend on achieved MPG, mileage, fuel price, and implementation costs.
For a cleaner fuel efficiency comparison, calculate gallons per 100 miles as well as MPG. It makes the consumption difference easier to see: 6 MPG uses about 16.7 gallons per 100 miles, while 6.5 MPG uses about 15.4. Multiply the difference by expected mileage and your own fuel price; do not apply a percentage improvement from a different fleet to your budget.
What it triggers with DOT
Fuel savings do not override inspection and maintenance obligations. For commercial motor vehicles subject to the federal rules, 49 CFR 396.3 requires systematic inspection, repair, and maintenance; 49 CFR 396.11 and 396.13 address driver vehicle inspection reports and driver inspections, with applicability and exceptions in the rules. Keep required records and correct defects under the applicable provisions. Check state requirements and your fleet's vehicle classifications as well.
Idling restrictions can also vary by state and locality, with exceptions that depend on the jurisdiction and circumstances. Give drivers route-specific guidance rather than assuming one national rule applies everywhere. If a technology or policy changes how equipment is operated, review the relevant requirements before rollout.
My rule for fuel efficiency investments is straightforward: put the baseline, the cost, the operating impact, and the compliance check on one page. What it costs, what it pays back, what it triggers with DOT. If those answers are not clear, the pilot is not ready for a fleetwide purchase order.